For Business

Trading Strategies

What Is the Opening Range Breakout

The opening range breakout is built on a box: the highest high and lowest low of the first half hour after the stock market opens, and the first close outside it. This paper shows you the Nasdaq's 14 November 2025 open from real five-minute bars — a 343-point box and the 17:25 close over its top; the idea as a window whose frame is built in thirty minutes; the box and the rest of the day on the chart; 20 November, when the price stepped over the top for one bar and finished the day 1,162 points under the sill; and the server clock on your platform that says when the box is drawn.

Difficulty
Intermediate
Reading time
5 min
Pages
8
Reviewed by
Saman Rahbar

This paper is locked

Read it in the browser and keep the PDF with Premium, or buy this one paper.
The first half hour draws a box

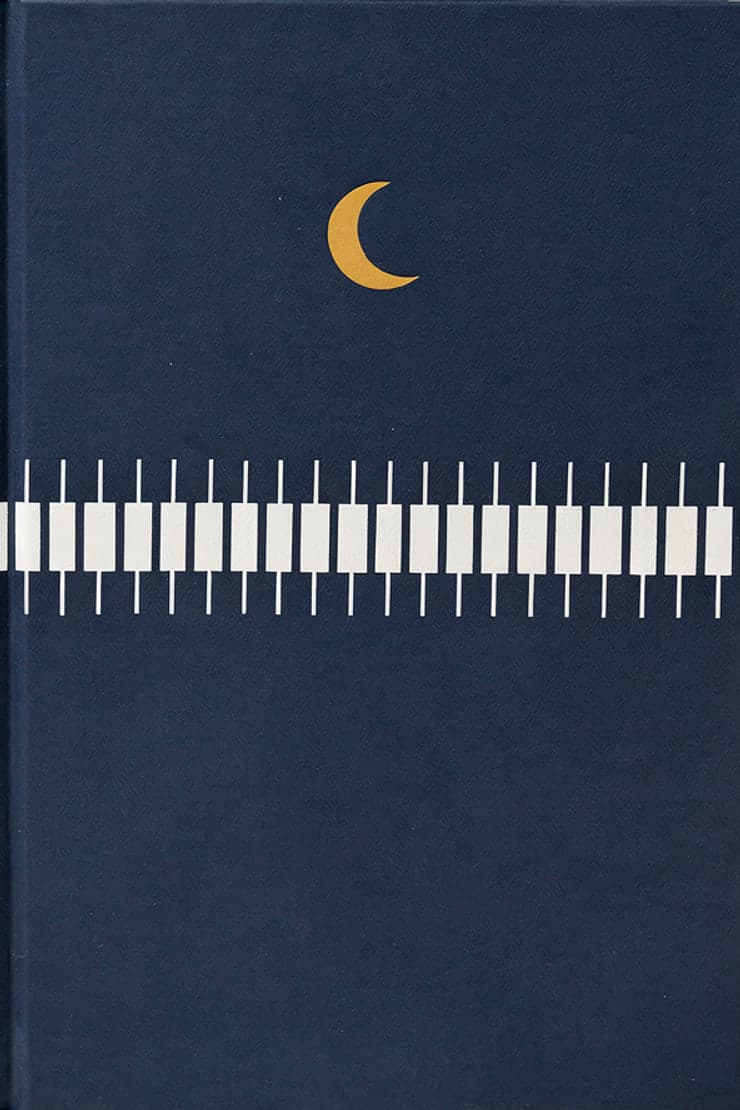
The opening range breakout is built on a box and the first close outside it. The box is the opening range: the highest high and lowest low of the first half hour after the stock market opens. Take the Nasdaq on 14 November 2025. The American market opened at 9:30 in New York, 16:30 on this feed's clock, and the first six five-minute bars ran from 24527.67 to 24871.15, a box 343 points tall. The two edges are carried forward across the day. At 17:25 a bar closed at 24910.74, the first close outside the box. That box, and the first close outside it, is what the strategy watches for.

A window

Picture a window. The first half hour of the session builds the frame — the high is the top, the low is the sill — and for those thirty minutes the strategy does nothing but watch the frame take shape. After that the price is either inside the window or out of it. The strategy's moment is the price climbing out, over the top or under the sill, and which way it climbs is which way the strategy is looking. The window is built once a day, at the open. Everything the rest of the day does is measured against its frame, and tomorrow's frame is a new one.

This paper is locked