For Business

Trading Strategies

What Is the Moving Average Crossover Strategy

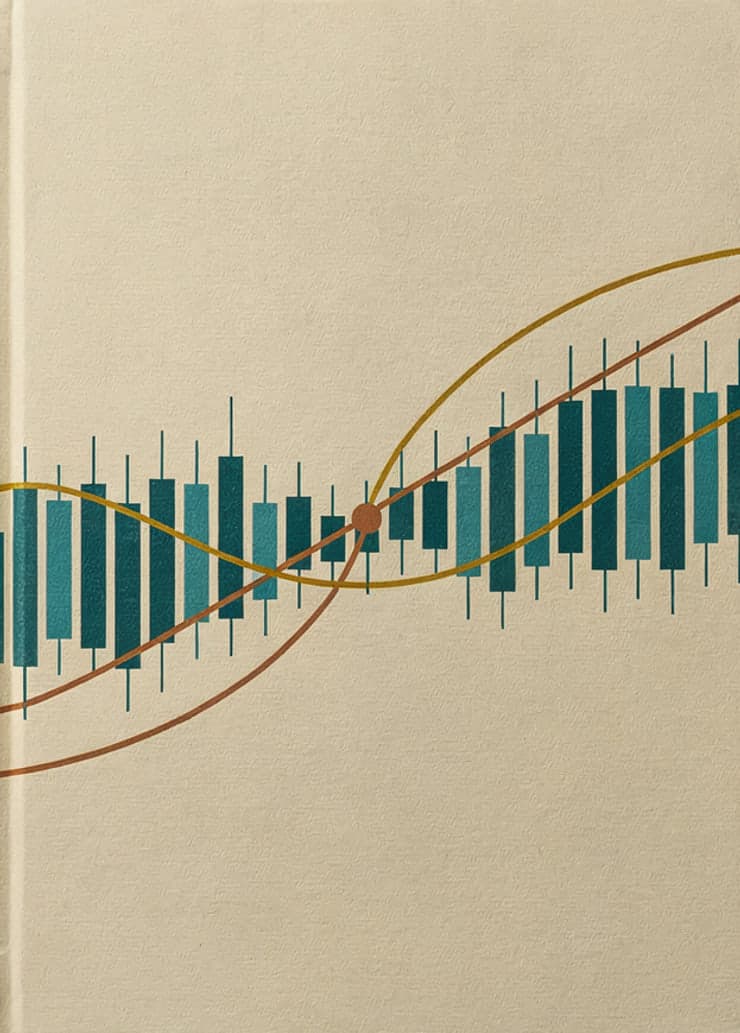
The moving average crossover is a strategy built on two averages of different lengths and the day one passes the other. This paper shows you gold's twenty-day and fifty-day averages through 2025 from real closes, crossing five times, the idea as the hands of a clock, three of the crosses ringed on the daily chart, the summer in which the two lines ran two dollars apart and crossed four times in four weeks, and the Data Window on your platform that reads both values to the cent.

Difficulty
Intermediate
Reading time
5 min
Pages
8
Reviewed by
Saman Rahbar

This paper is locked

Read it in the browser and keep the PDF with Premium, or buy this one paper.

Two averages, and the days they crossed

The moving average crossover is a strategy built on two averages of different lengths. Here are gold's, from real daily closes through 2025: the average of the last twenty closes in blue and the average of the last fifty in gold. The two lines crossed five times in the year. On 17 January the faster line went over the slower, and it stayed over for six months; then between 30 July and 25 August they crossed four times in four weeks. The fast line sat above the slow one on 240 of the year's 258 days. The strategy is the two lines, and the day one passes the other.

The hands of a clock

Picture the hands of a clock. The minute hand goes round quickly and the hour hand creeps, and every so often the fast one passes the slow one; the passing takes a moment, and it happens wherever the two hands happen to be on the dial. The fast average is the minute hand and the slow average the hour hand. The strategy watches for the passing, not for a place on the dial: a crossover reads the same whether it happens at 2650 or at 3340, and it says nothing about either number.

This paper is locked