For Business

Trading Strategies

What Is the Ichimoku Cloud Break Strategy

The Ichimoku cloud break strategy reads which side of the cloud the close is on — under, inside, or above — and watches for the day that changes. This paper shows you the Nasdaq's 12 May 2025 break from real bars, the first close above the cloud in eleven weeks, 532.88 points over its top; the idea as an aeroplane climbing out of cloud into clear air; the break and the 136 days above the cloud that followed, on the chart; November 2025, when the close came out on top for one day and out below the next; and the Colors tab that shades the cloud on your platform.

Difficulty
Intermediate
Reading time
5 min
Pages
8
Reviewed by
Saman Rahbar

This paper is locked

Read it in the browser and keep the PDF with Premium, or buy this one paper.

A close that comes out of the cloud

The Ichimoku cloud break strategy is built on the cloud and one close. The cloud is a band between two lines drawn from the midpoints of past highs and lows and pushed twenty-six days forward, so the cloud under any day was drawn from bars a month or more before. The close is either under it, inside it, or above it. Take the Nasdaq in May 2025. On 8 and 9 May the close was inside the band. On 12 May it closed at 20868.25, 532.88 above the cloud's top — the first close above the cloud since 24 February. A close that comes out of the cloud is what the strategy watches for.

An aeroplane climbing out of cloud

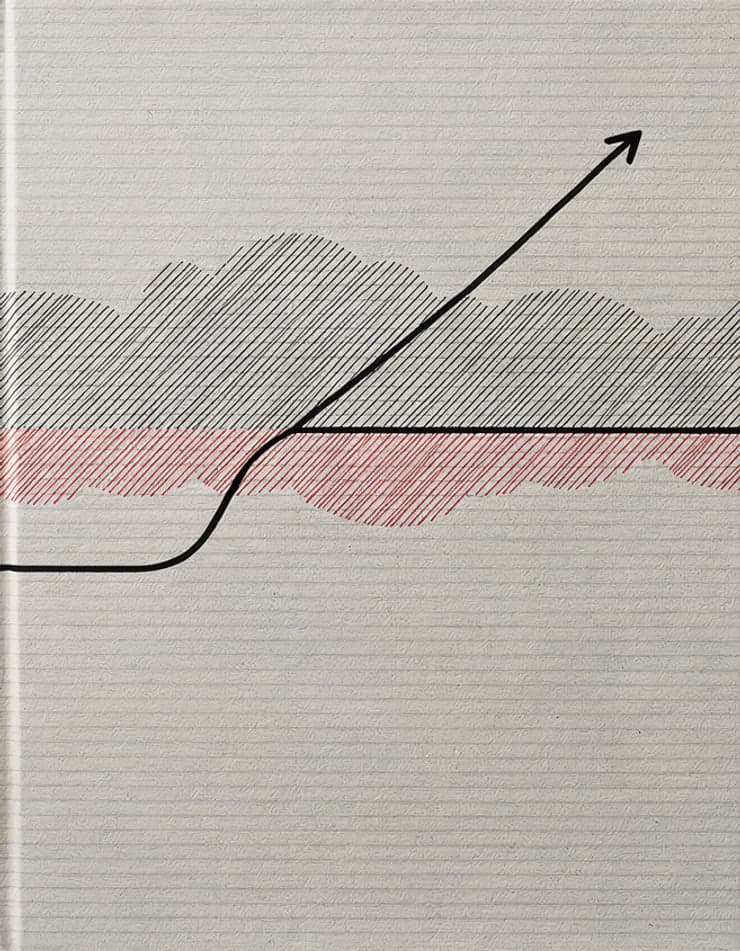
Picture an aeroplane climbing through a cloud. Under the cloud is one kind of weather, on top of it in clear air is another, and inside it there is nothing to see at all. The Ichimoku cloud is a band with a top and a bottom, and the strategy reads which side of it the close is on — under, in, or above — and watches for the day that changes. Inside the cloud there is nothing to read, and the strategy waits. The cue is the day the close comes out of it, above or below, and which way it comes out is which way the strategy is looking.

This paper is locked