For Business

Trading Psychology

What Is Recency Bias

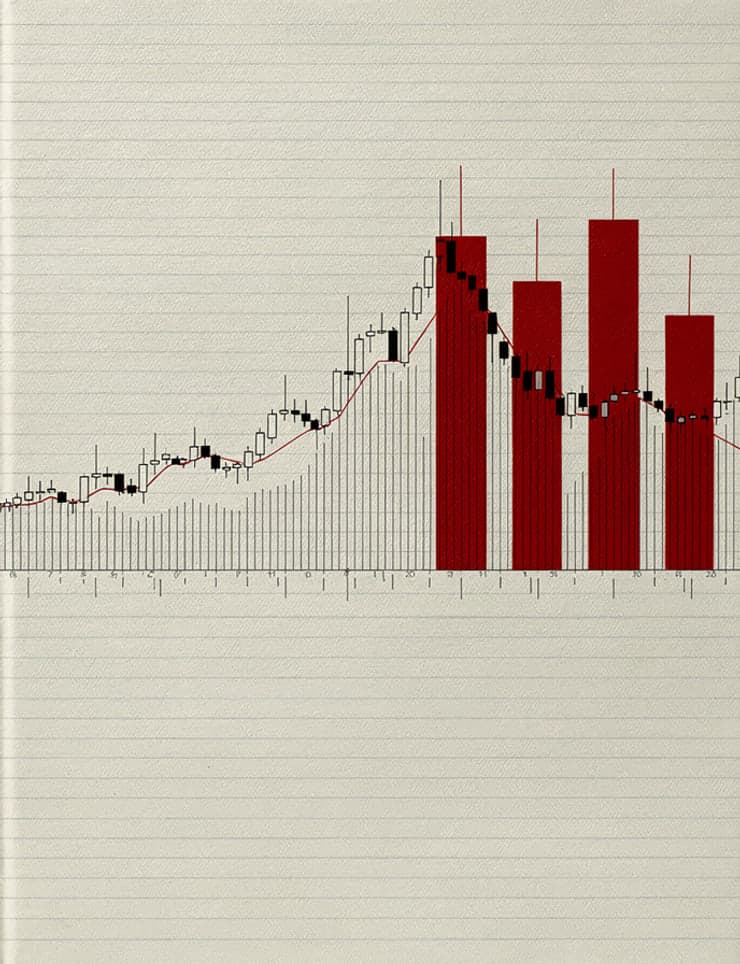
Recency bias is the last thing seen weighing more than everything seen before it, so that the recent past is taken for what the market is. This paper shows you gold's average day's range over twenty days read on 29 January 2025 at 31 dollars and on 30 October at 98, the year's lowest and highest; the idea as a rear-view mirror; the whole year on daily bars with the range pane beneath; the year through a keyhole the size of twenty days; and the timeframe and zoom buttons on your platform that open the keyhole.

Difficulty
Beginner
Reading time
5 min
Pages
8
Reviewed by
Saman Rahbar

This paper is locked

Read it in the browser and keep the PDF with Premium, or buy this one paper.
Two readings of the same gold

Recency bias is the last thing seen weighing more than everything seen before it. The measure here is the average day's range over the last twenty days, which the platform calls the ATR 20. On 29 January 2025 it read 31 dollars: gold, to a trader who had watched those twenty days, was a market that moved about 30 a day. On 30 October 2025 it read 98: to a trader who had watched those twenty days, gold was a market that moved about 100 a day. They were the year's lowest and highest readings, nine months apart, on the same metal. Each trader believed the recent past was the market. The market was both, and neither.

A rear-view mirror

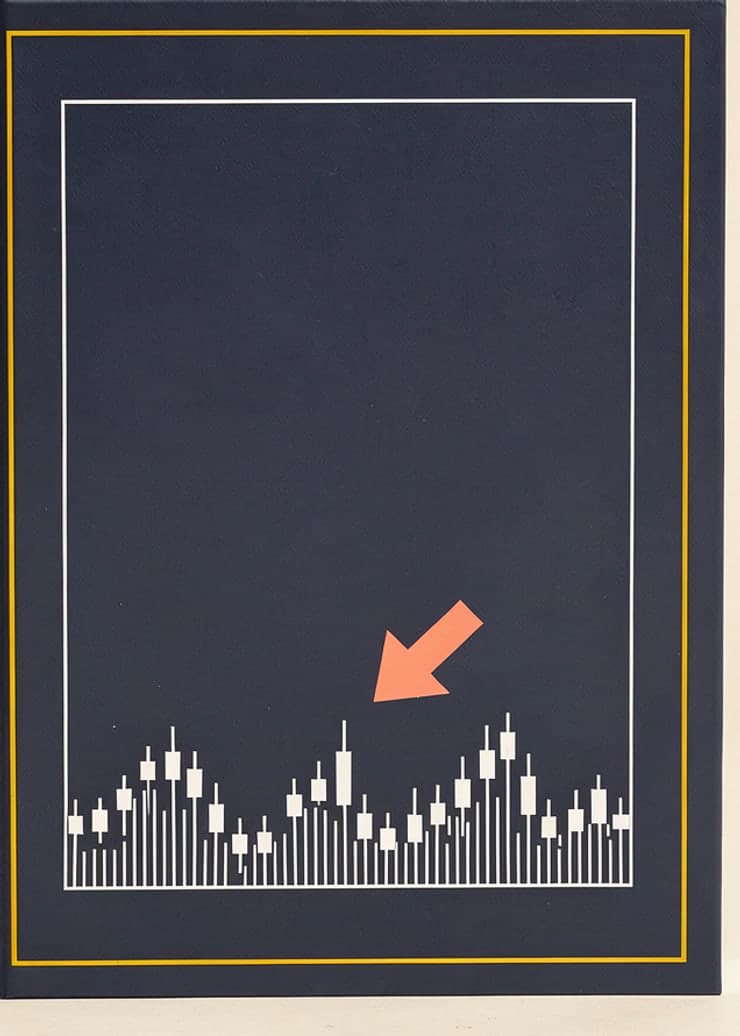
Picture a rear-view mirror. It is accurate, and it is small: what it shows is the last few hundred metres of road and nothing older, however long the road behind actually is. The gold stripes in the mirror are the last twenty days; the grey stripes along the bottom are the year and the years before it, which the mirror does not reach. Recency bias is driving by the mirror. The piece of road it shows is real, which is what makes it convincing, and it is the shortest piece there is. A trader who has only ever looked in the mirror has no idea how long the road is.

This paper is locked