For Business

Trading Strategies

What Is Mean Reversion

Mean reversion is the family of strategies built on the price wandering from its average and coming back: they trade the coming back. This paper shows you a year of gold's distance from its twenty-day average from real closes, crossing the line 34 times in 2025 with the widest gap, 402 dollars, closed in seven trading days, the idea as a pendulum, the widest gap on the daily chart, the two ways a gap can close and which one the strategy counts on, and the envelopes tool that draws the distance on your platform.

Difficulty
Beginner
Reading time
5 min
Pages
8
Reviewed by
Saman Rahbar

This paper is locked

Read it in the browser and keep the PDF with Premium, or buy this one paper.

A year of distance from the average

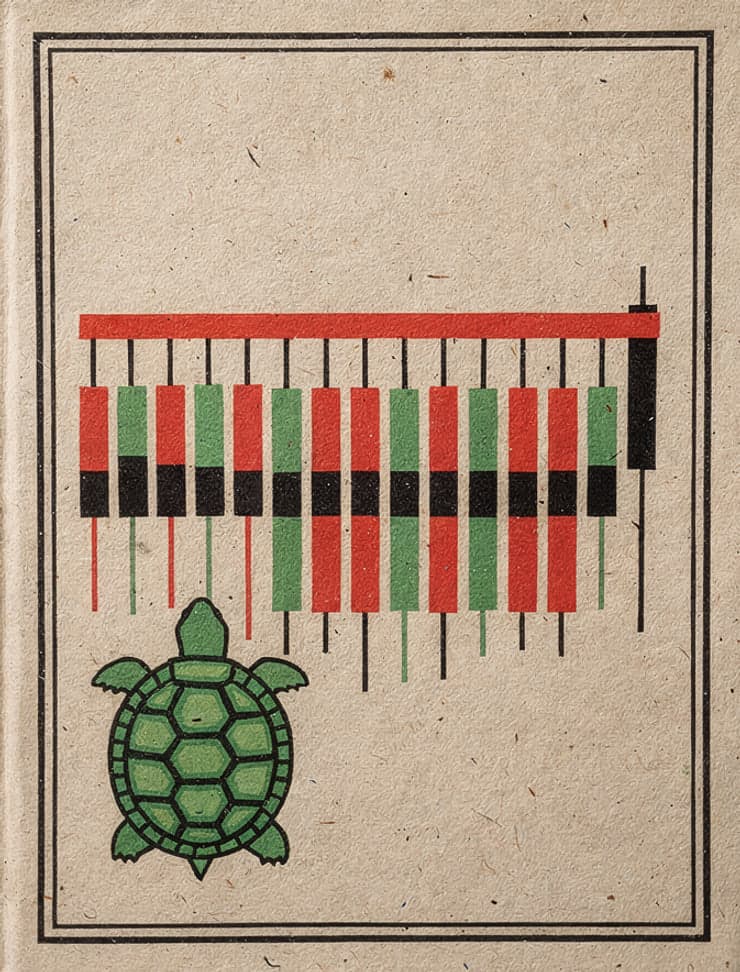
Mean reversion is built on one observation: the price wanders from its average and comes back. Here is a year of it, from real closes: gold in 2025, each day a bar from the twenty-day average to where the close sat, green above and red below. The close crossed the line 34 times in the year. The furthest it wandered was 402 dollars above, on 16 October, and it was back at the line seven trading days later; on 21 April it was 289 above and back in nine. Every stretch away closed. The strategy trades the coming back.

A pendulum

Picture a pendulum. Pull the bob away from the middle and it comes back, and the further it was pulled, the harder it comes; but it comes back through the middle, not to it, and swings out the other side. The middle is the average. A mean reversion strategy is built on the coming back, and it has to remember two things the pendulum shows. The bob overshoots. And the middle itself moves, because the average is worked out again every day from the newest closes.

This paper is locked