

For Business

Price Action

What Is a Triangle Pattern

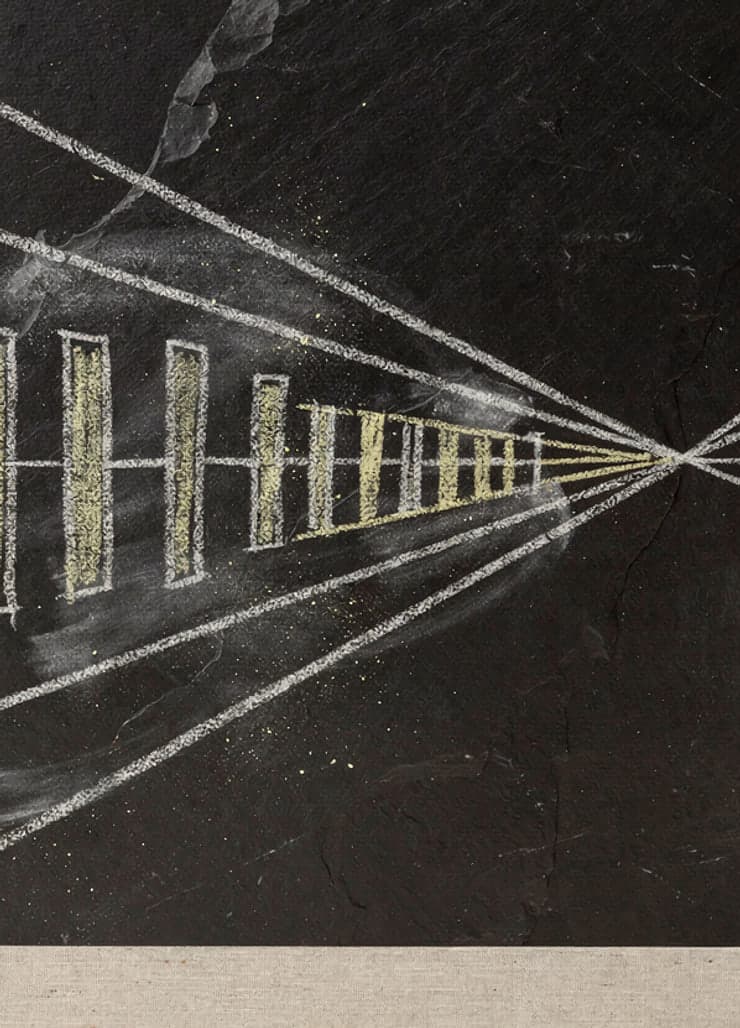
A triangle is a stretch where the highs come down and the lows come up, so that a line through each meets the other and the swings between them get smaller. This paper shows you a real one drawn from gold in the autumn of 2024, the three kinds named for which line is flat, the triangle on the daily chart with the close that left it, a descending triangle on the euro, and the triangle object on your platform.

Difficulty
Intermediate
Reading time
5 min
Pages
8
Reviewed by
Saman Rahbar

This paper is locked

Read it in the browser and keep the PDF with Premium, or buy this one paper.

Two lines that meet

A triangle is a stretch of chart where the highs come down and the lows come up. Gold made highs of 2790, 2721 and 2666 dollars between 31 October and 29 November 2024, each lower than the last, and lows of 2537, 2605 and 2614, each higher. A line through the highs slopes down; a line through the lows slopes up; the two meet. Between them the swings shrank from about 250 dollars to about 50. That narrowing, drawn by two lines, is the triangle.

Three kinds

Triangles are named for which line is flat. When both lines slope and meet in the middle, as on gold, it is symmetrical. When the highs stop at one price while the lows rise toward it, the top line is flat and the triangle is ascending. When the lows stop at one price while the highs fall toward it, the bottom line is flat and it is descending. In every kind the swings get smaller as the two lines close in on each other.

This paper is locked

