

For Business

Indicators

What Is a Pivot Point Indicator

A pivot point indicator takes yesterday's high, low and close and draws five flat lines across today: the pivot, two lines above it and two below, fixed before the day begins. This paper shows you the euro's 17 September 2025 drawn from real bars with the lines the day before set for it, the idea as a rubber stamp cut from yesterday's candle and pressed onto today's page, the lines on the quarter-hour chart, the three numbers and few sums behind them, and where the indicator is found on your platform, which does not ship one.

Difficulty
Intermediate
Reading time
5 min
Pages
8
Reviewed by
Saman Rahbar

This paper is locked

Read it in the browser and keep the PDF with Premium, or buy this one paper.

Yesterday's candle, today's lines

A pivot point indicator takes yesterday's high, low and close and draws five flat lines across today. The middle one is the pivot, the average of the three; two lines sit above it, R1 and R2, and two below, S1 and S2. From 16 September 2025 — high 1.18785, low 1.17573, close 1.18667 — the pivot for 17 September was 1.18342. The euro reached 1.19189 that day, above R1, and closed at 1.18121, just under the pivot. The lines were set before the day began and did not move during it.

A rubber stamp

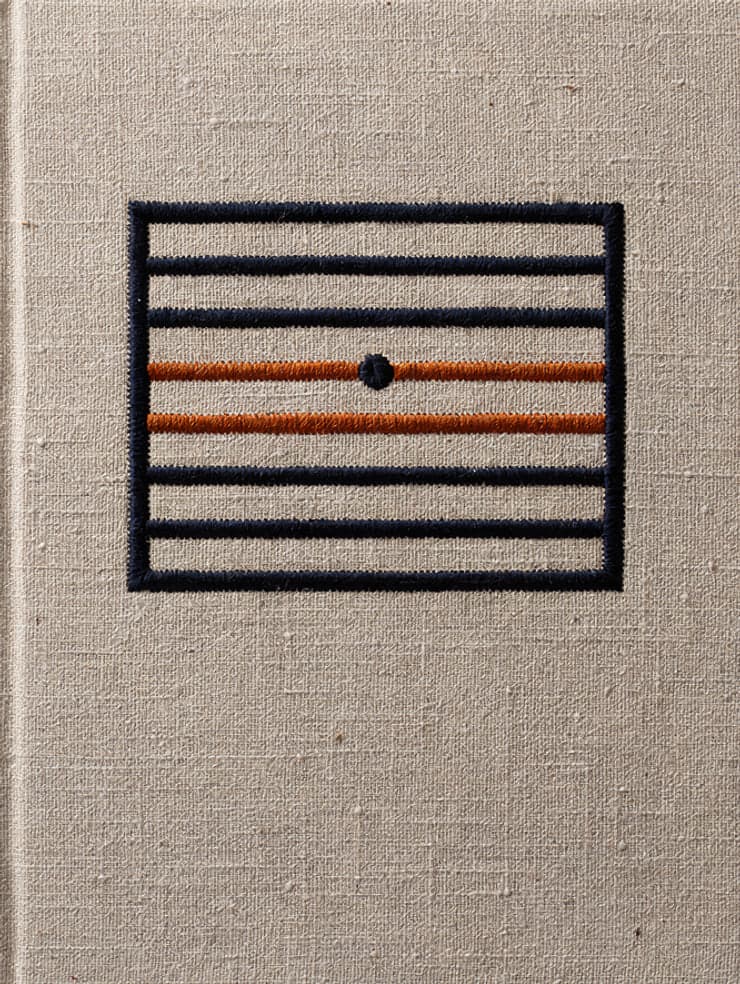
The picture is a rubber stamp. The stamp is cut from yesterday's candle — its high, its low and its close — and at midnight it is pressed onto today's page, printing five flat lines across the day. The print does not change while the day runs, however the price moves; a new stamp is cut every evening from the day just finished. The indicator is that stamping, done for you at the turn of each day, and the lines are what the stamp leaves.

This paper is locked

