

For Business

Price Action

What Is a Hammer Candle

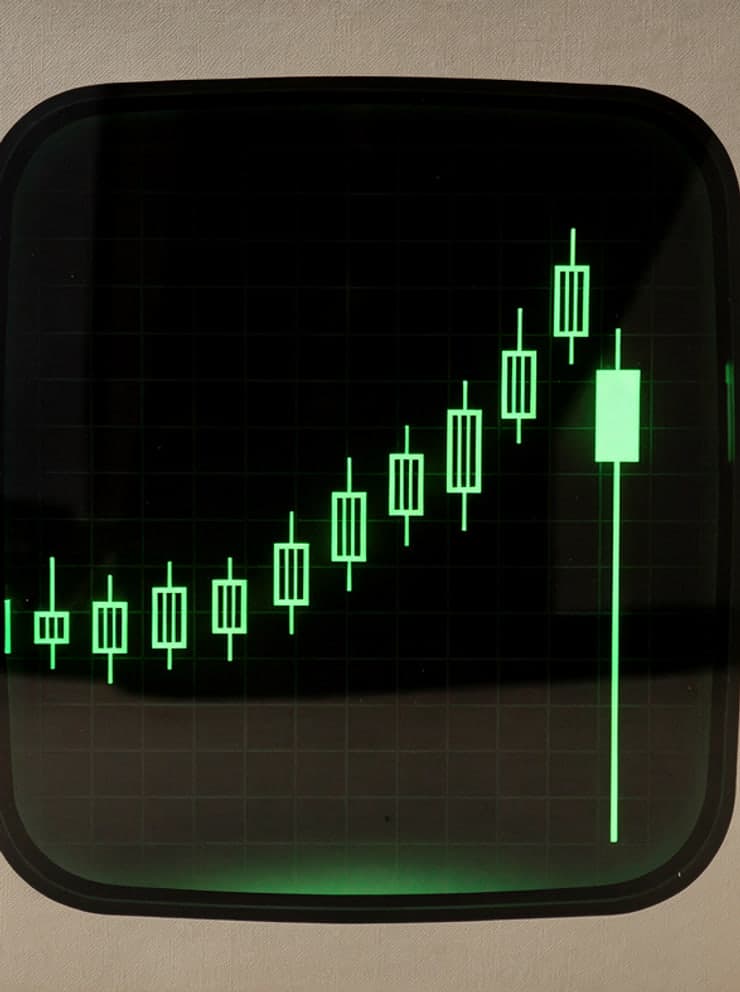
A hammer is a candle with a small body near its top and a lower wick at least twice as long, appearing after a fall: sellers pushed the price down and lost all of it before the close. This paper shows you a real hammer drawn large, the hour-by-hour path that made it, the same candle on the chart at the year's low, why the identical shape after a rise has another name, and how to measure the wick with the crosshair on your platform.

Difficulty
Beginner
Reading time
5 min
Pages
8
Reviewed by
Saman Rahbar

This paper is locked

Read it in the browser and keep the PDF with Premium, or buy this one paper.

The shape

A hammer is a candle with a small body near its top and a lower wick — the thin line below the body — at least twice as long as the body, with little or nothing above. The euro against the dollar drew one on 13 January 2025: a body of nine pips — a pip being the fourth decimal place, the smallest step most people count in — over a wick of 58. Sellers took the price down 58 pips during the day and lost every one of them by the close. That is what the shape records. The name applies only when the candle comes after a fall; the same shape after a rise is something else, and the paper comes to that.

The day that made it

Follow the price through the day and the shape explains itself. It fell through the morning, reached its low at 11:00, 58 pips under the open, and spent the afternoon not far above that low. In the last hour it rose 28 pips and closed at 1.02440, nine pips above where it had opened. Fold the twenty-four hours into one candle and the fall and the recovery become the lower wick, while the final hour's rise becomes the small green body at the top.

This paper is locked

