For Business

Trading Strategies

How to Know a Strategy Stopped Working

A strategy has stopped working when the assumptions it was written on no longer describe the market, and that is read off the chart, not off the last few results. This paper shows you gold's typical day in January 2025, 31.43 dollars, and in October, 97.98, with the same ten-dollar band on each; the idea as a key cut for a lock that has since been changed; the day's size drawn under the price through the autumn; the card's four assumptions put beside January's and November's numbers at review; and the Data Window that reads the market's number on your platform.

Difficulty
Advanced
Reading time
5 min
Pages
8
Reviewed by
Saman Rahbar

This paper is locked

Read it in the browser and keep the PDF with Premium, or buy this one paper.
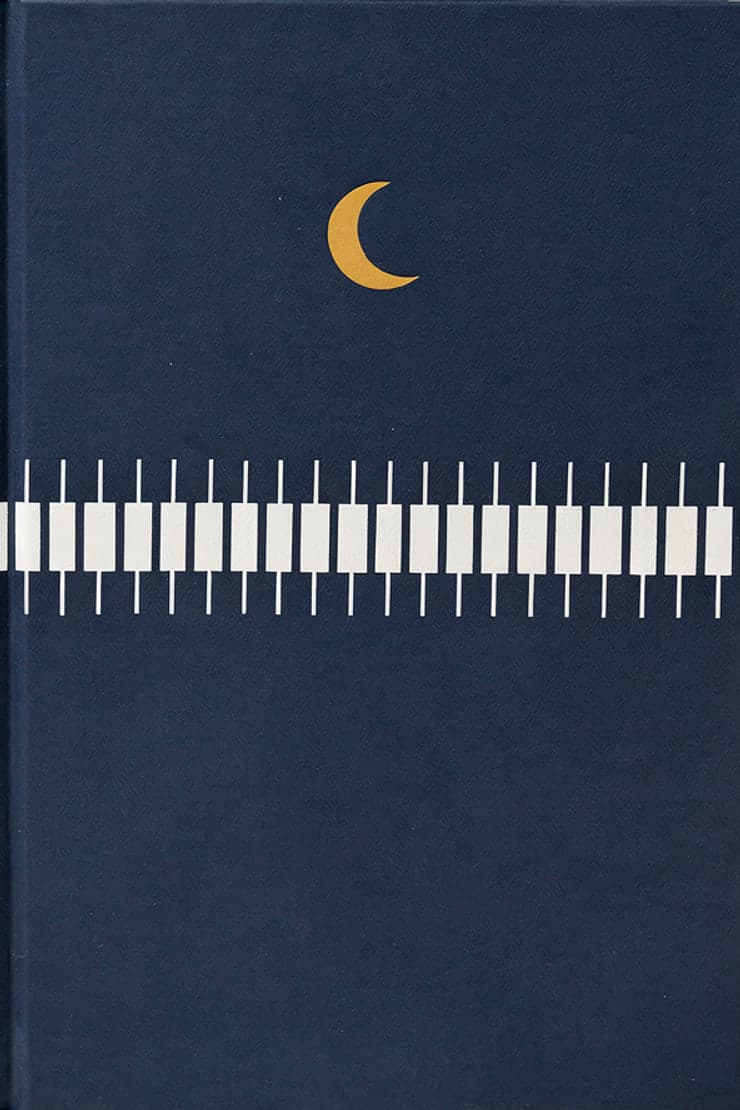
The same ten dollars on two days

A strategy is written on assumptions about the market: how far it moves in a day, how often its cue comes, when it is read. It stops working when those assumptions stop being true, and the first place to look is the size of the day. Take gold in 2025. On 29 January the typical day — the average true range over twenty days — was 31.43 dollars; on 30 October it was 97.98, three times as much. A card written in January that says within ten dollars of the average was describing a third of a day. By October the same words described a tenth of one, and the card did not know.

A key and a lock

Picture a key and a lock. The key is the card, its numbers cut once, when it was written. The lock is the market. A key that stops turning has not worn out; the lock it was cut for is not the one on the door any more, because locks get changed — a typical day of 31 dollars becomes a typical day of 98. Knowing a strategy has stopped working is checking the lock, not blaming the key. The market's numbers are on the chart, the card's are on the card, and the review line on the card is where the two are put side by side.

This paper is locked