For Business

Market Basics

What Is Volatility

Volatility is how far the price travels in a day. This paper shows you what it looks like — a calm day and a wild day from the same real month, drawn large and marked on the chart — why volatility is about the size of the move and not its direction, and how to measure any day's range on your own chart in a minute.

Difficulty
Beginner
Reading time
6 min
Pages
7
Reviewed by
Saman Rahbar

This paper is locked

Read it in the browser and keep the PDF with Premium, or buy this one paper.
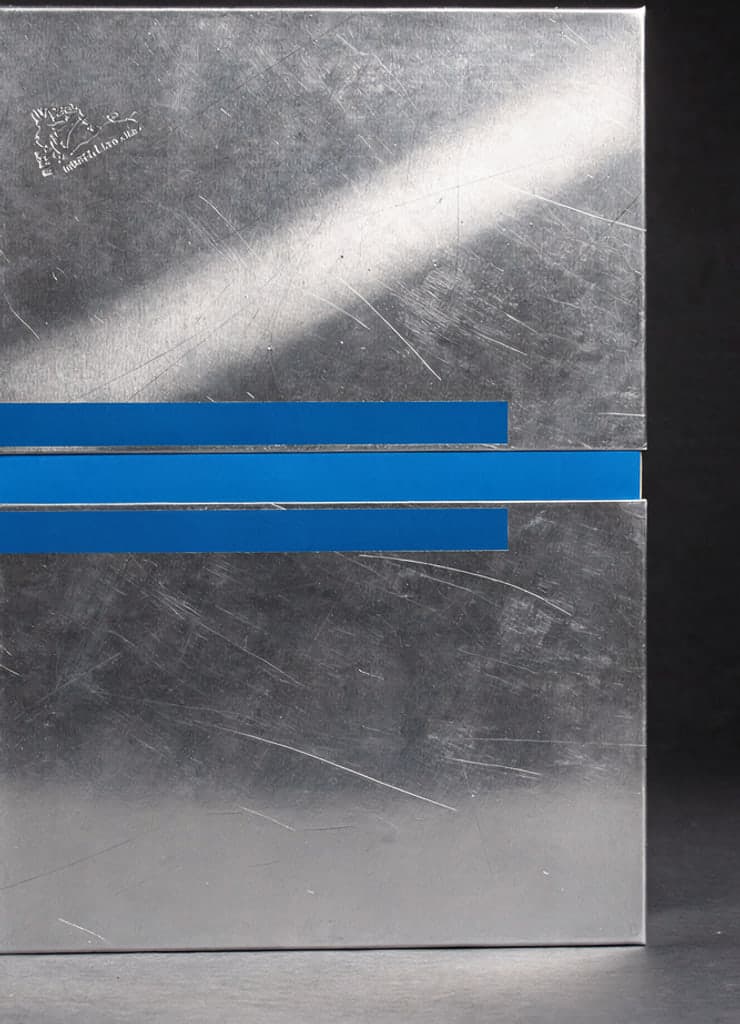
A calm day and a wild day

Volatility is how far the price travels. Take one day of the euro against the dollar and draw it as a candle: the thin line runs from the lowest price of the day to the highest, and that distance is the day's range. On 8 September 2026 the range was 28 pips — a pip is the fourth decimal place of the price, the smallest step most people count in. On 19 August 2026 it was 109. The second day was four times as volatile as the first: the price simply travelled four times as far.

On the chart

Here are the same two days in their place on the chart, one tall and one short. Look along the row of candles and you can see that volatility is not one number: it changes from day to day. Some stretches are made of short candles, where the market moves little; some are made of tall ones, where every day covers a long way. A market described as volatile is one whose candles have been tall lately.

This paper is locked