

For Business

Trends & Market Structure

What Is an Uptrend

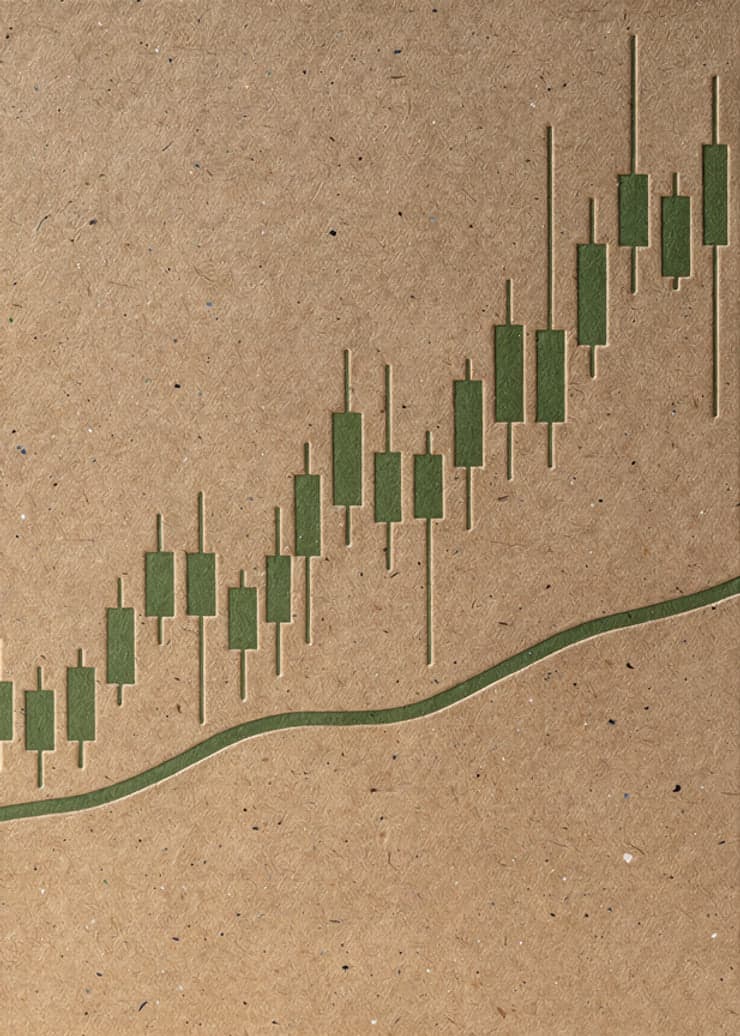
An uptrend is a stretch where every time the price comes back down it stops higher than it stopped the last time, so the floor keeps rising. This paper shows you one drawn from the Nasdaq's climb from April to August 2025, the idea as a balloon rising in gusts, the rising floor on the daily chart, the climb cut into its seven legs, and how to draw the floor with the trend line by angle on your platform.

Difficulty
Beginner
Reading time
5 min
Pages
8
Reviewed by
Saman Rahbar

This paper is locked

Read it in the browser and keep the PDF with Premium, or buy this one paper.

The climb

An uptrend is a stretch where every time the price comes back down, it stops higher than it stopped the last time. The Nasdaq index — the price of a basket of a hundred large American technology companies, quoted in points — went from 16,323 on 7 April 2025 to 23,967 on 13 August. Along the way it came down five times, to 16,323, 17,586, 20,660, 21,419 and 22,662, and each of those lows is higher than the one before it. Join them and you have the rising floor. The rising floor is the uptrend.

A balloon rising in gusts

The picture is a balloon rising in gusts. Every gust pushes it down a little, and every dip ends higher than the dip before it, so over the afternoon it climbs. The dips are not the opposite of the rise; they are part of it. What makes the afternoon an uptrend is not that the balloon never came down. It is that each time it did, it stopped higher than the last time.

This paper is locked

