

For Business

Trends & Market Structure

What Is a Trend Line Break

A trend line break is a candle that closes on the far side of a line the price had been turning at — not a wick that dips through and comes back, but a day that ends with the line on the wrong side. This paper shows you one drawn from gold's turning points in the autumn of 2024, the idea as a branch that bends many times and then snaps, the break on the daily chart, the days around it one candle each, and how to slide a trend line into place on your platform.

Difficulty
Intermediate
Reading time
5 min
Pages
8
Reviewed by
Saman Rahbar

This paper is locked

Read it in the browser and keep the PDF with Premium, or buy this one paper.

A line under three lows, and a close under it

A trend line break is a close on the far side of a line the price had been turning at. A line drawn under gold's lows of 5 August and 4 September 2024 rose 4.9 dollars a day, and the 10 October low landed four dollars above it: three touches, three turns. On 6 November the price fell from 2743 to close at 2659, thirty-three dollars under the line, which by then stood at 2692. For the first time in three months a day finished on the far side of the line. That close is the break.

A snapped branch

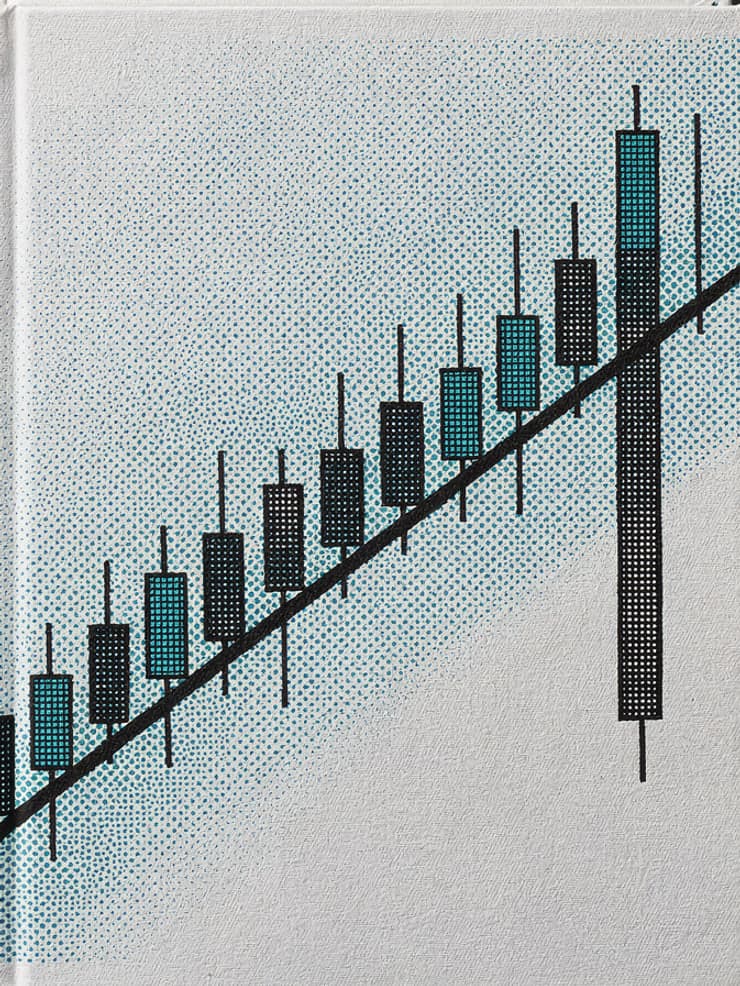
The picture is a branch. It bends under weight many times and springs back; every touch of the price on the line is a bend, and the line holds. Then one day it snaps, and the end that was held up comes down. A trend line break is the snap: not a wick — the thin line beyond a candle's body — that dips under the line and comes back, which is a bend, but a candle whose body closes on the far side, so the day ends with the line no longer under the price.

This paper is locked

