

For Business

Trends & Market Structure

How to Measure Trend Strength

Trend strength is measured, not felt, and three numbers read off the chart do it: the slope in pips a week, the share of weeks that closed in the trend's direction, and how much of each leg the pullbacks took back. This paper works the three on the euro's rise of 2025, shows the idea as a spring scale, counts the weeks on the weekly chart, runs the same three measures on the weaker stretch that followed, and shows the standard deviation channel that draws two of them on your platform.

Difficulty
Advanced
Reading time
5 min
Pages
8
Reviewed by
Saman Rahbar

This paper is locked

Read it in the browser and keep the PDF with Premium, or buy this one paper.

Three numbers

Trend strength is measured, not felt, and three numbers read off the chart do it. The slope: the euro's rise of 2025 covered 1,652 pips in twenty-four weeks, about 69 pips a week, a pip being the fourth decimal place, the smallest step most people count in. The share: of the twenty-five weekly candles from the week of 13 January to the week of 30 June, fifteen closed higher than they opened. The pullbacks: the three legs against the trend took back 9, 73 and 57 percent of the leg before each. Three numbers, each saying something different.

A spring scale

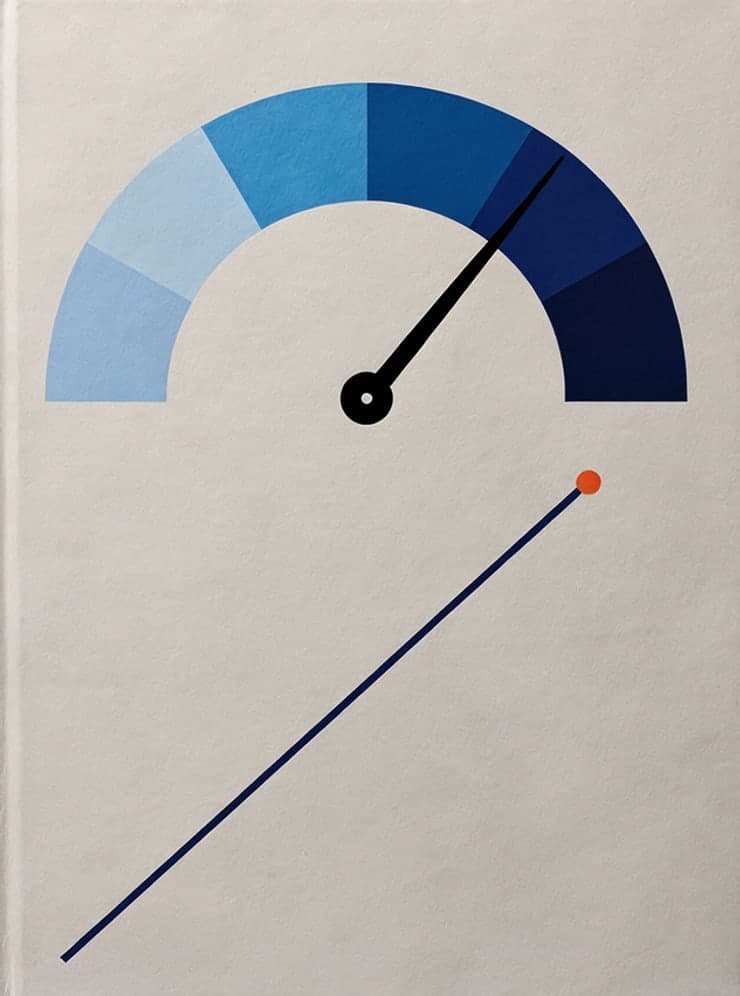
The picture is a spring scale. The weight pulls, the spring stretches, and the pointer stops at a number on the dial. Strength is that number, read off the dial, and not a feeling about the weight. A trend is measured the same way: a slope in pips a week, a share of up weeks, a share of each leg given back. The dial gives numbers. Whether a number is large is a comparison with other trends the reader has measured, and further on in this paper there is a weaker stretch to compare with.

This paper is locked

